![[Superseded]](figures/lifecycle-superseded.svg)
create_studies_map.RdCreate a cloropleth map of the number of trials in a dataset
Usage
create_studies_map(
  data,
  country_col,
  include_ATA = FALSE,
  include_n = TRUE,
  title = "",
  subtitle = "",
  legend = "Number of Studies",
  colour_high = "#14B1E7",
  colour_low = "#CCECF9",
  colour_default = "#FDF3F4",
  colour_borders = "black",
  colour_background = "#FFFFFF",
  colour_text = "black",
  scale_breaks = pretty_breaks(),
  log_scale = FALSE
)
Arguments
- data
Data frame with includes a column with 3 letter ISO country codes which are to plotted on the map.
- country_col
Character. The name of the column containing the 3 letter ISO country codes.
- include_ATA
Boolean. Should Antarctica be included on the map? Default is
FALSE.- include_n
Boolean. Should
n = Xwhere X is the number of participants, be included in the map. Default isTRUE.- title
Character. Title of the choropleth map. Default in blank.
- subtitle
Character. Subtitle of the choropleth map. Default in blank.
- legend
Character. Legend title of the choropleth map. Default is 'Nuber of Studies'
- colour_high
Colour of the high end of the scale, either using the name of a base colour or the HEX code, i.e. "red" or "#F9250C. This will be the colour of the country with the highest value. Default is IDDO-branded blue "#14B1E7".
- colour_low
Colour of the low end of the scale, either using the name of a base colour or the HEX code, i.e. "red" or "#F9250C. This will be the colour of the country with the lowest value. Default is IDDO branded blue at 30% tint, "#CCECF9".
- colour_default
Colour of the other countries without trial data, either using the name of a base colour or the HEX code, i.e. "red" or "#F9250C. Default is IDDO branded red at 5% tint, "#FDF3F4".
- colour_borders
Colour of the country borders, either using the name of a base colour or the HEX code, i.e. "red" or "#F9250C. Default is "black".
- colour_background
Colour of the plot background, either using the name of a base colour or the HEX code, i.e. "red" or "#F9250C". Default is "#FFFFFF" (white).
- colour_text
Colour of the legend title, text and 'n = ' (if include_n == TRUE), either using the name of a base colour or the HEX code, i.e. "red" or "#F9250C". Default is black.
- scale_breaks
Numeric list. Specify custom scale breaks for the legend, i.e. c(100, 500, 1000, 2000). Default is pretty_breaks from the scales package.
- log_scale
Boolean. Should the number of trials be transformed into the log scale for when the distribution of values is very uneven. Default is
FALSE.
Details
This function is superseded, create_map replaces this function and is the recommended alternative.
Examples
library(worlddatr)
set.seed(123) # for reproducibility
countries <- sample(world_income$alpha_3_code, 100, replace = FALSE)
probabilities <- runif(length(countries))
probabilities <- probabilities / sum(probabilities)
country_data <- data.frame(COUNTRY = sample(countries, 10000, replace = TRUE, prob = probabilities))
create_studies_map(data = country_data,
country_col = "COUNTRY"
)
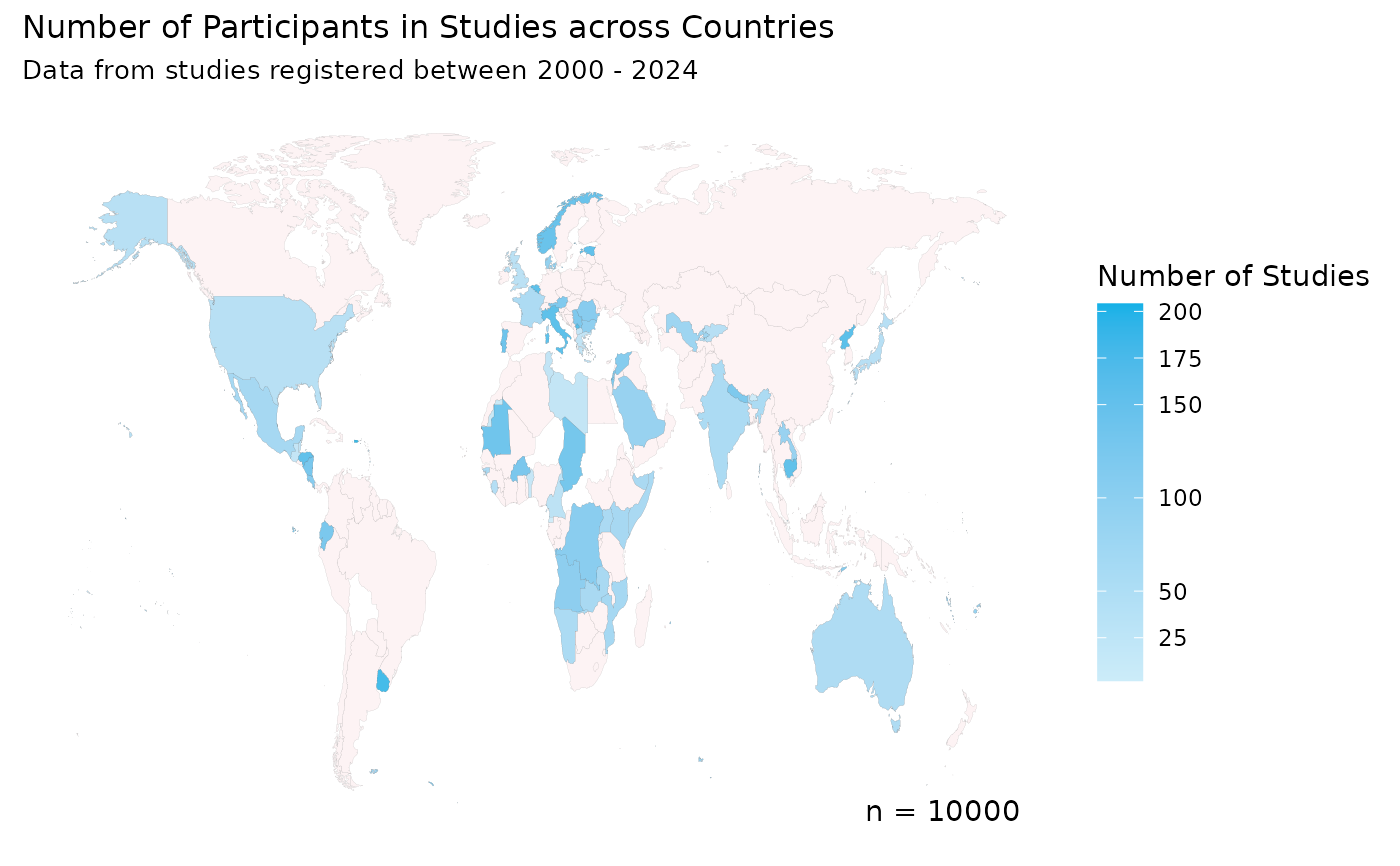
 create_studies_map(data = country_data,
country_col = "COUNTRY",
include_ATA = FALSE,
include_n = TRUE,
title = "Number of Participants in Studies across Countries",
subtitle = "Data from studies registered between 2000 - 2024",
colour_high = "#14B1E7",
colour_low = "#CCECF9",
colour_default = "#FDF3F4",
colour_borders = "black",
colour_background = "#FFFFFF",
colour_text = "black",
scale_breaks = c(25, 50, 100, 150, 175, 200),
log_scale = FALSE
)
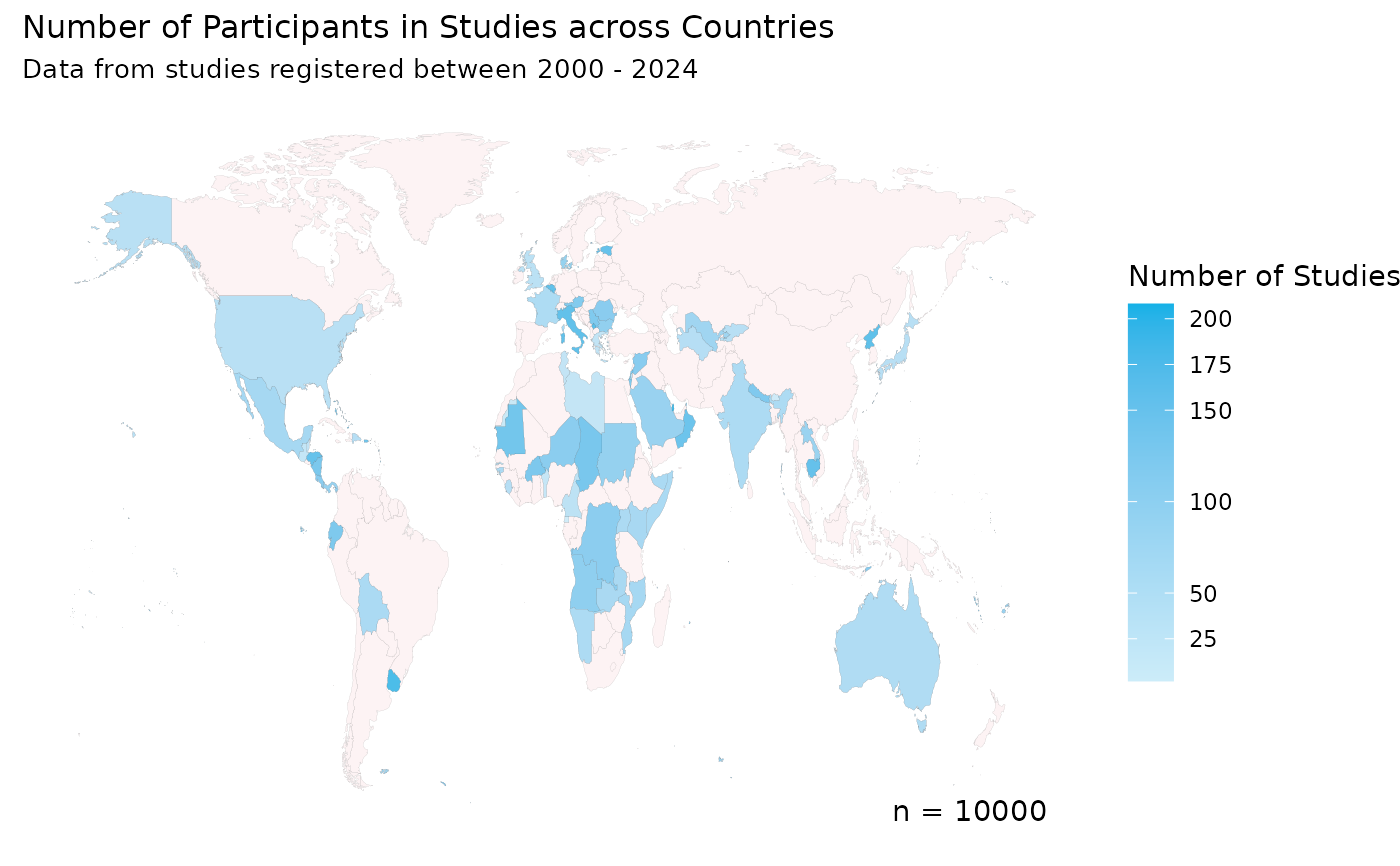
create_studies_map(data = country_data,
country_col = "COUNTRY",
include_ATA = FALSE,
include_n = TRUE,
title = "Number of Participants in Studies across Countries",
subtitle = "Data from studies registered between 2000 - 2024",
colour_high = "#14B1E7",
colour_low = "#CCECF9",
colour_default = "#FDF3F4",
colour_borders = "black",
colour_background = "#FFFFFF",
colour_text = "black",
scale_breaks = c(25, 50, 100, 150, 175, 200),
log_scale = FALSE
)